Your Sales Team is Hitting Every Target - So Why is Revenue Down?
Relying on single KPIs can sabotage your sales success. Discover why CRM dashboards with balanced scorecards are essential for driving real results, not just activity.
Christian Wettre
EVP, GM North America

Picture this: Your sales team hits their target of 100 calls per day. Everyone's celebrating. The KPI is green across the board. But at the end of the quarter, revenue is down. What went wrong?
This scenario plays out in organizations every day, and it highlights one of the most dangerous traps in sales management: the isolated KPI. Worse yet, by the time you're looking at revenue numbers, you're looking at a lagging indicator - the damage is already done, and it's too late to fix it.
The Problem with KPI Tunnel Vision
When sales leaders focus on a single key performance indicator, they create a dangerous blind spot. A salesperson who's measured solely on call volume will make calls - lots of them. But are they calling the right prospects? Are those calls converting to meetings? Are meetings turning into opportunities? Are opportunities closing?
The harsh truth is that activity doesn't equal results. You can have perfect execution on the wrong metric and still fail spectacularly.
This phenomenon even has a name: Goodhart's Law. British economist Charles Goodhart observed that "when a measure becomes a target, it ceases to be a good measure." In other words, the moment you make a single metric the goal, people start optimizing for that number rather than the underlying business objective. The metric loses its value as a true indicator of performance.
Common isolated KPIs that mislead include:
- Number of calls made (without measuring call quality or target appropriateness)
- Emails sent (without tracking engagement or response rates)
- Meetings scheduled (without monitoring meeting outcomes or qualification)
- Opportunities created (without considering deal quality or close probability)
Each of these metrics tells you something, but none tells you everything. And that's the problem.
Enter the Dashboard: Your Balanced Scorecard for Sales Success
This is where CRM dashboards become invaluable. Rather than fixating on a single number, dashboards implement the balanced scorecard concept - a methodology that provides a comprehensive view of performance across multiple dimensions.
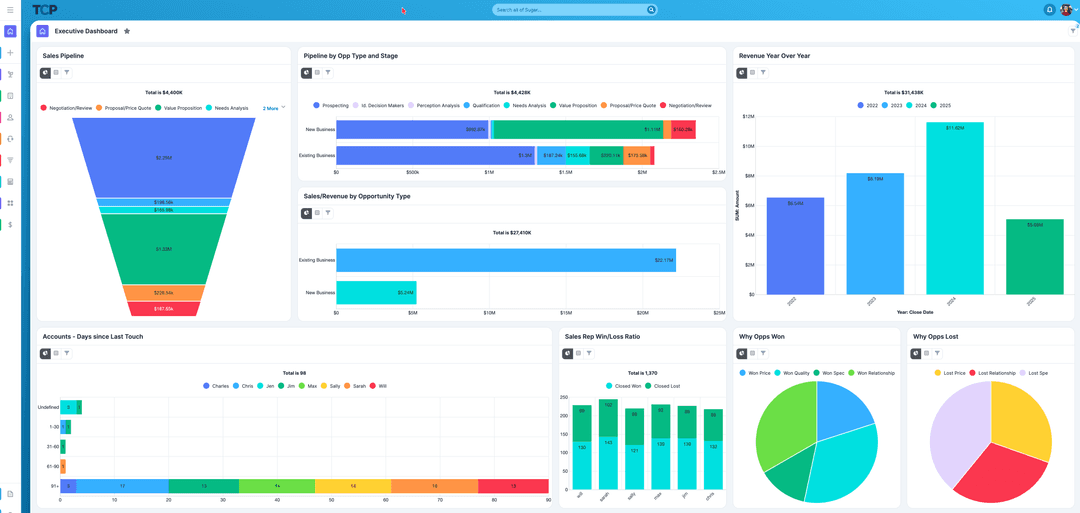
A well-designed CRM dashboard doesn't just show you activity; it shows you the complete story of your sales process:
Activity Metrics - Are your sellers engaging with the market?
- Calls made, emails sent, meetings scheduled
Quality Metrics - Are they engaging with the right people?
- Target account penetration, decision-maker contact rate, ideal customer profile alignment
Progress Metrics - Is that engagement moving deals forward?
- Conversion rates between pipeline stages, average time in stage, advancement velocity
Outcome Metrics - Is the process producing results?
- Win rates, average deal size, revenue generated, quota attainment
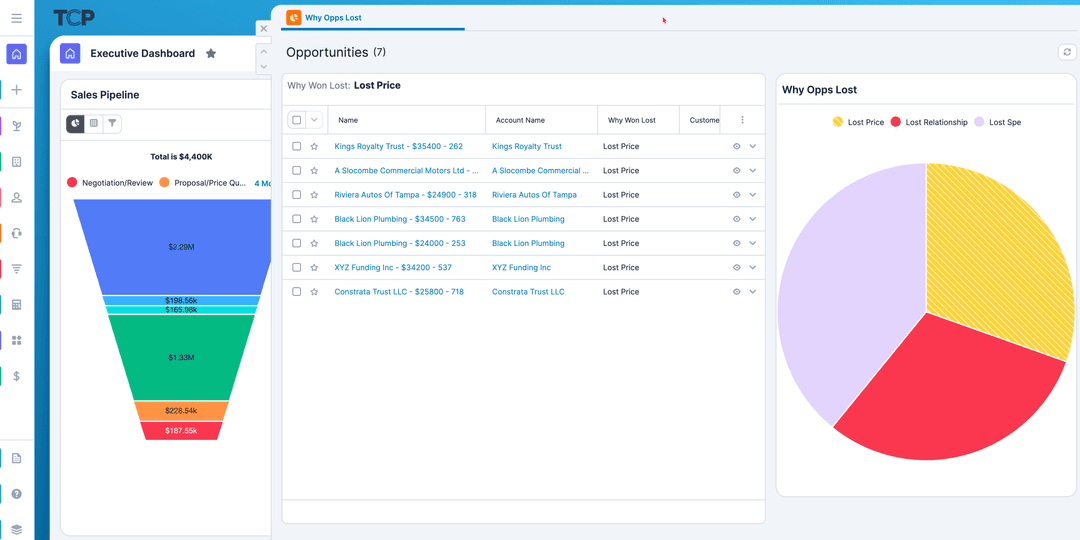
When you view these metrics together, patterns emerge that single KPIs can never reveal. You might discover that your team makes plenty of calls but struggles to reach decision-makers. Or that they're great at getting meetings but weak at advancing opportunities. These insights are invisible when you're only tracking call volume.
The SugarCRM Advantage: Building Your Balanced Dashboard
When deploying a CRM like SugarCRM, the goal isn't simply to track more data - it's to create a balanced set of KPIs that ensure your sales processes run well and produce good results.
SugarCRM's dashboard capabilities allow you to:
Create Role-Specific Views - Sales reps see their individual metrics and pipeline health. Managers see team performance and coaching opportunities. Executives see revenue forecasts and strategic trends.
Monitor Leading and Lagging Indicators - Track both the activities that predict future success (leading indicators like qualified meetings) and the results that measure past performance (lagging indicators like closed revenue). This is critical because revenue is a lagging indicator - by the time you discover that revenue is down, it's too late to do anything about it. Leading indicators give you the early warning system you need to course-correct before problems become crises.
Establish Cause-and-Effect Relationships - Connect activities to outcomes. When you see both call volume AND conversion rates, you can identify whether low results stem from insufficient activity or ineffective execution.
Set Contextual Benchmarks - Compare individual performance against team averages, historical trends, and industry standards to identify both top performers and those who need support.
Implementing Dashboards That Drive Performance
Successful CRM dashboard deployment requires more than just turning on features. Consider these essential elements:
Start with Process, Not Technology - Before building dashboards, map your sales process. What are the critical stages? What activities drive progression? What outcomes matter most? Your dashboard should reflect your process, not the other way around.
Balance Is Key - Include metrics across the full sales funnel. Too many activity metrics and you'll drive busyness without results. Too many outcome metrics and your team won't know what actions to take.
Make It Actionable - Every metric on your dashboard should answer the question "So what?" If a number is red, what should the salesperson do differently? If it's green, what behavior should they maintain?
Review and Refine - Your dashboard isn't set in stone. As your business evolves, your metrics should too. Regular review sessions help ensure your balanced scorecard remains relevant and drives the right behaviors.
Enable Self-Service - The best dashboards empower sellers to monitor their own performance and make adjustments without waiting for their manager to tell them something's wrong.
From Data to Decisions: The Real Power of Balanced Dashboards
When implemented correctly, CRM dashboards transform how sales teams operate. Instead of blindly pursuing activity targets, sellers gain visibility into what's working and what isn't. Managers shift from micromanaging tasks to coaching for results. Leaders can forecast with confidence because they understand not just what's happening, but why.
The salesperson who made 100 calls to the wrong people? With a balanced dashboard, they would have seen early warning signs - low connection rates with decision-makers, poor conversion from calls to meetings, stagnant pipeline value. They could have adjusted course before wasting weeks on unproductive activity.
That's the power of the balanced scorecard approach. It turns your CRM from a reporting tool into a strategic guidance system.
Ready to Build Dashboards That Drive Results?
At TCP Americas, we've helped numerous organizations deploy SugarCRM with carefully crafted dashboards that provide the balanced visibility sales teams need to succeed. We don't just implement technology - we work with you to identify the right KPIs for your unique sales process, design dashboards that drive behavior change, and ensure your team has the insights they need to consistently hit their targets.
Don't let isolated KPIs sabotage your sales success. Let's build a dashboard strategy that gives you the complete picture.
Contact TCP Americas today to learn how we can help you deploy SugarCRM dashboards that balance activity, quality, progress, and results - because measuring the right things is the first step to achieving them.


